

JdB35 - EN : Patience and maturation
JdB35 - EN : Patience and maturation
After a week trading below $50K, the Bitcoin market is adopting a structure close to the early stages of a bull run, while overall on-chain activity diverges from market sentiment.

A consolidation is taking place on the Bitcoin price action. After an unsuccessful test of the $50K hard zone, the price bounced off the intersection of the EMA 21 and the MA 200, forming a weekly low of $46,327.
Around this important pivot zone, many on-chain indicators point that a long-term bullish bias continues to build, although the short-term environment remains uncertain.
This week, let's dive into metrics related to:
on-chain activity;
token maturation.

Slow on-chain activity
For several weeks now, on-chain analysts have been observing a slowdown of the blockchain pulse.
Loss of engagement, lower transaction volumes & fees indicates that activity on the Bitcoin network is quiet, surprisingly quiet.
While many altcoins are outperforming BTC and ETH, on-chain activity for both protocols remains low, with demand for block space staying well below the highs reached in early 2021.
In fact, current activity on both chains appears to be very similar to the accumulation phase that began in mid-2020.
Checkmate notes that for Bitcoin, the number of active addresses has bounced back to around 275K per day, which is still 35% less than the peak engagement set in January.

The same goes for the number of transactions, which is about 200K per day, a volume that we would like to see increasing.

On the Ethereum ecosystem side, the picture is very similar: few active addresses, few transactions and little volume.
Down 33% from the May peak, 450K Ethereum addresses are active per day. This level coincides with previous dates such as August and December 2020.

Similarly, the number of transactions also fell by 26.6% during that week to about one million Tx per day.

Regarding the DeFi sector, the picture doesn't look much better.
Here is the on-chain transaction data for some DeFi tokens: AAVE, COMP, UNI and YFI.
At the top: active addresses interacting with the tokens.
At the bottom: the USD value transferred by these tokens.
Not an encouraging picture, with all four tokens experiencing a structural decline in traction from participants, some of them even hitting their weekly lows.
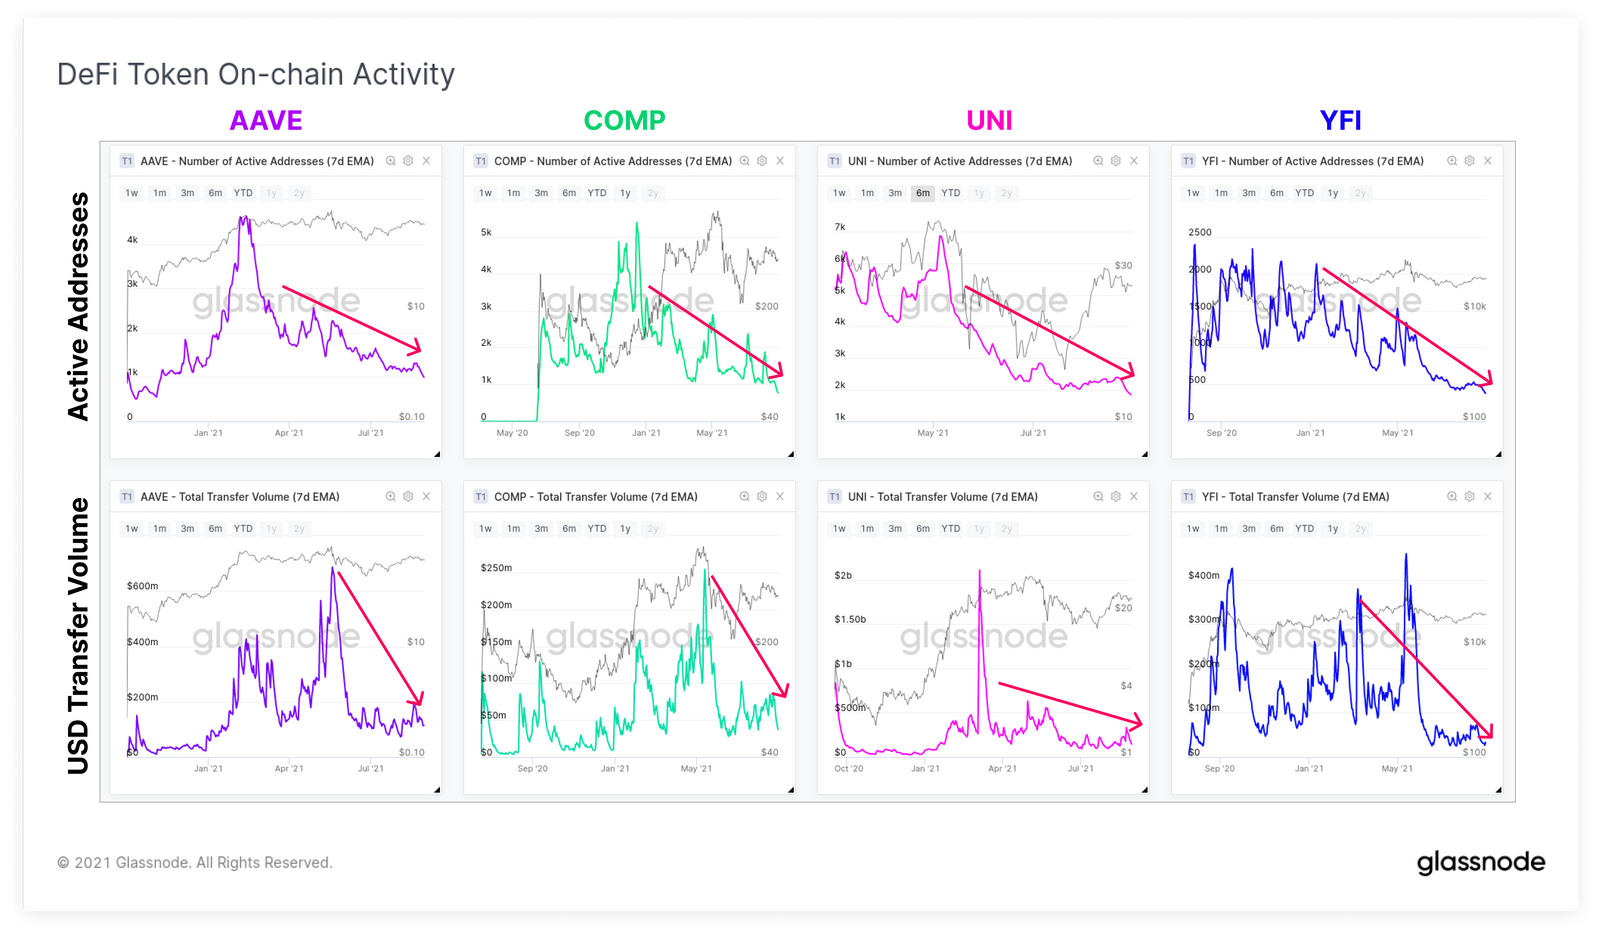
In reality, this reduced activity is not abnormal. Rather, it is unexpected, given the way the market is behaving at the moment.
Interpreting such divergences between on-chain activity and token price action is complex and must be observed dynamically.
It is true that the development of the Lightning Network, as well as the RGB and Taproot implementations are likely to bring a measurable impact on the blockchain.
However, the fear that the May correction generated leads me to believe that this calm is also due to the withdrawal of many players (especially short-term holders) who were violently shaken by the volatility.
The only left are smart money, long term holders and participants with strong conviction.
Maturing tokens
Despite this unexpected on-chain activity, the behavior of token holders last week indicated a clear accumulation phase for Bitcoin, with over 92% of addresses in profit.
What about the behavior of the tokens? Let's be precise. How does the held BTC evolve over time?
Let's look at a new metric, related to the maturation of tokens: the HODL Waves (HODL stands for conviction and holding of a token over long period)
This indicator provides a macro view of the age distribution of tokens and gives insight about the evolution of this distribution, resulting from a HODLer's holding or spending.

The longer a token is unspent, the more it will mature and be transferred from younger to older age brackets. Statistically, the more mature a token is, the less likely it is to be spent.
Regarding young BTC held for less than 3 months, a prolonged decline indicates that the market is not spending. These tokens mature and reach ages greater than 3 months, disappearing from their currrent age range.
Young BTC now only represent 15% of the total supply. This indicates that investors are adopting a long-term behavior, not allowing time for young tokens to be spent.
Looking at the older age brackets (between 6 months and 1 year), we can observe a classic behavior: the tokens are distributed in the strength of the rise before being accumulated again during the consolidation and correction phases.

This is typical of long-term investors taking profits when selling pressure can be absorbed by the market, then resuming accumulation when market sentiment is at its lowest.
This is also valid for young ETH tokens, which follow the same behavior, a sign of a deep holding decision.


An other way to represent this maturation is offered by CoinMetrics. Here we can observe very clearly, in 2014 and 2018, the transfer of tokens from young tokens (left) to old slices (right) through time, illustrating the long term behavior of HODLers.

To highlight this change in the participants behavior, the liveliness of both networks has started declining again.
Liveliness is a metric that provides insight about the changing behavior of HODLers, helping to identify the accumulation or distribution bias of LTHs.
Uptrends suggests an accumulation during which tokens mature and are inactive, resulting in less spending.
Downtrends suggests a distribution when large spending occur and mature tokens are activated, reducing their lifespan to 0.
Thus Bitcoin's liveliness has resumed a downtrend that has accelerated since the recent price rise. Accumulation is picking up steam.

Likewise, non-zero Bitcoin addresses have continued to grow, once again above 38M addresses and being on the verge of surpassing the old ATH. A very encouraging sign.

The same structural observation can be made for Ethereum, whose liveliness is decreasing, while the number of non-zero addresses of Ethereum reaches a new peak of 60.7 Mln addresses.


The maturation dynamics of tokens seem to indicate that many investors are practicing HODL, encouraging a long-term bullish bias.
One invalidating signal to keep in mind would be the upward reversal of liveliness and the decrease in old age bands, meaning that mature tokens are being spent : a prelude to a potential distribution phase.
On-chain supports/resistances?
As reported last week, some participants sold a portion of their tokens in order to realize profits.
The aSOPR (Adjsuted Spent Output Profit Ratio) indicator reflects the degree of profit/loss realized for all BTC traded on-chain, excluding trades of less than an hour.
Excellent sign: after returning to positive values, the aSOPR remains above 1, an indication that the profits made (constituting selling pressure) are being absorbed by the market.

However, it can be noted that the price of BTC seems to be consolidating between $45K and $50K for the past few days. This can be explained by more profit taking around $50K, combined with the fact that some traders are probably shorting the resistance.
However, a range price can only choose 3 directions:
North (up) ;
East (continuation of the range and lower volatility) ;
or South (down).
As the BTC price consolidates, I would like to try an experiment: determine what technical levels BTC could react to, based on on-chain data only!
Primo, the UTXO Realized Price Distribution (URPD) tells us at what prices the set of BTC tokens traded for the last time. This metric measures the volume of BTC accumulated by price. A sort of on-chain cost basis.

Thus, there are 3 distinct volume bands :
From $31K to $40K (floor of the current phase), where over 2.98M BTC were accumulated, both in January 2021 and during the consolidation of May. This is now a very strong support area.
From $45K to $50K (current range), where 1.65M BTC were traded. With the current price of BTC at the upper end of the range, just above the EMA 21 and MA 200, it is likely that this level will also serve as price support if strong bearish pressure does not occur.
From $53.7K to $59K, where 1.336M BTC were accumulated between March and May and are still underwater. These tokens are the survivors of the May correction and could provide significant resistance if investors seeks to close their positions around break-even.
Secondly, by modeling the orders volumes present on the market over time, the Material Scientist heatmap allows us to clearly visualize where the areas of high density, likely to act as resistance or support on the price of BTC, are located.

On this animation of the orders volume established this week, we can clearly distinguish 4 zones of preponderant density.
30K, which defines the bottom of the consolidation that followed the May sell-off. This is the last bastion that the price will have to defend to avoid a bear market.
41K - $43K which serves as support for the BTC price in its current range.
50K - $53K which, in the same vein, serves as resistance to the price. It can be seen that this area has become denser over the week.
60K which is the medium term objective to reach in order to restart a bullish phase.
Thus, by combining Glassnode's URPD and Material Scientist's heat map, it is possible to establish the following support and resistance levels based on on-chain data.

Some will argue that these same levels could have been established via technical price analysis. This is true.
However, it is my opinion that the on-chain analyst and the technical analyst should not compete but rather complement each other.
A decision must be bakced by as many data and angles as possible.
Finally, in a field as young as on-chain analysis, why not look for new heuristics, new models, new formulas, while having fun?

To Sum Up
This week, the Bitcoin market is consolidating below $50K as the accumulation continues.
Despite an unexpectedly calm on-chain, it is difficult to interpret this divergence as a bullish, bearish or neutral signal.
Meanwhile, many BTC tokens are moving into more mature age bands as the asset's liveliness diminishes, a sign that a distribution is not yet in the cards.
Finally, a strong technical level seems to be established between $30K and $40K as the price stumbles on resistance which we don't know how long it can hold.