

JdB37 - EN : Easy come, easy go
JdB37 - EN : Easy come, easy go
While the recent flash crack sent the price of BTC back below $50K and the 200DMA, investors do not seem to be panicking and continue to accumulate.

A humble note from Prof. Chaine
Dear readers, as my learning progresses, I plan to add new sources and features to this newsletter.
Thus, the time has come to introduce CryptoQuant data to my analysis. Crossing multiple on-chain data providers gives us a broader view of the market and allows us to discover new methods, new heuristics.
I hope you will enjoy following the evolution of this "logbook", and I wish you a pleasant and enriching reading.
*A special thanks to @SwellCycle who provided the Glassnode graphics in this opus, I am very grateful to him!*
After breaking through the $50K zone, marking a local high of $52,723, the price of Bitcoin has seen a violent decline following a cascade of liquidations caused by the derivatives markets. Forming a weekly low of $44,175, the price is currently holding just below the 200DMA (purple).
This week, my focus is on :
derivative markets;
behavior of long-term holders;
exchanges capital flows.

Flash crack on the derivatives markets
Just after the release of the 36th opus, the price of Bitcoin plummeted by -18% in a few hours.
The origin of this decline? A cascade of long liquidations coming from the derivatives markets.
In less than 4 hours, 6.9M BTC tokens were taken from the hands of traders who used high leverage to bet on the market's rise.

In fiat terms, this represents more than 300M USD gone up in smoke. In human terms, it implies a disappointment for bullish speculators and for some, a financial but also psychological suffering.
When derivatives markets are overexposed to risk, it doesn't take much for the price, if it reverses, to take traders by surprise and liquidate their positions.

Forced to close their trades, they induce selling pressure that prompts other participants to sell, producing a domino effect where volatility peaks, as the Bitcoin Volatility Index shows us.

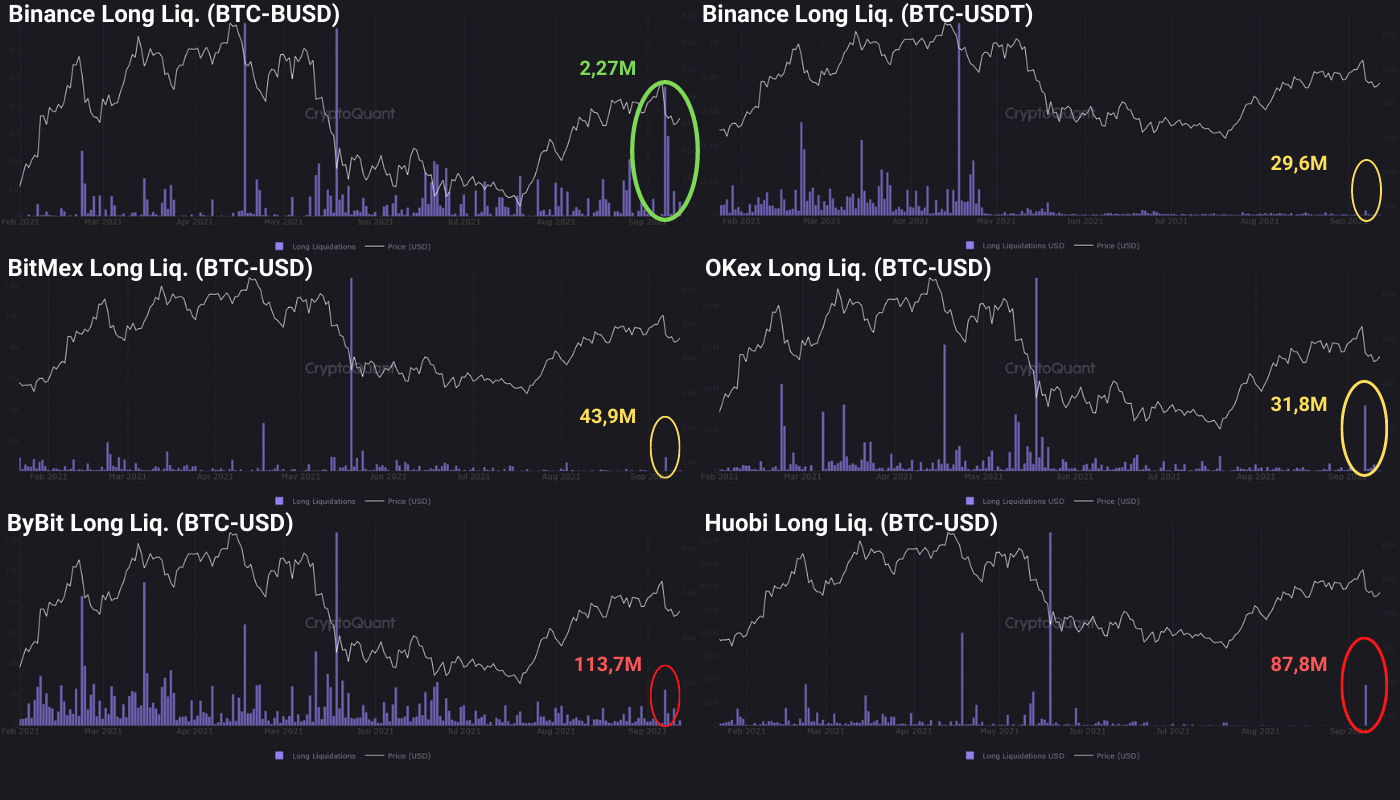
Diving into CryptoQuant’s data, we can asses that the exchanges that contributed the most to this flash crack were:
BitMex (43.9M $ liquidated);
Huobi (87.9M $ liquidated);
ByBit (113.7M $ liquidated).
Following this sharp drop, open interest in the derivatives markets rapidly declined by 30% in a few minutes.
However, the overall funding rate of the exchanges, after bouncing back on the neutral zone (FR = 0), remained in positive values.
This observation indicates that, despite the flash crack, the overall bullish bias has been maintained and that most investors have absorbed the drop without panicking.
Note that corrections of -10% to -40% are common during a bull run and allow the price to breathe before a new leg up.

As a result of this sudden move, 19,K BTC left the derivatives markets in the following days.
The overall leverage ratio fell from 0.182 to 0.142 over the week. A healthy rebalancing that shows the eviction of greedy speculators.
When playing with fire, you might get burned.

HODLers don't flinch
Despite the flash crack, it seems that more fear than harm has been felt.
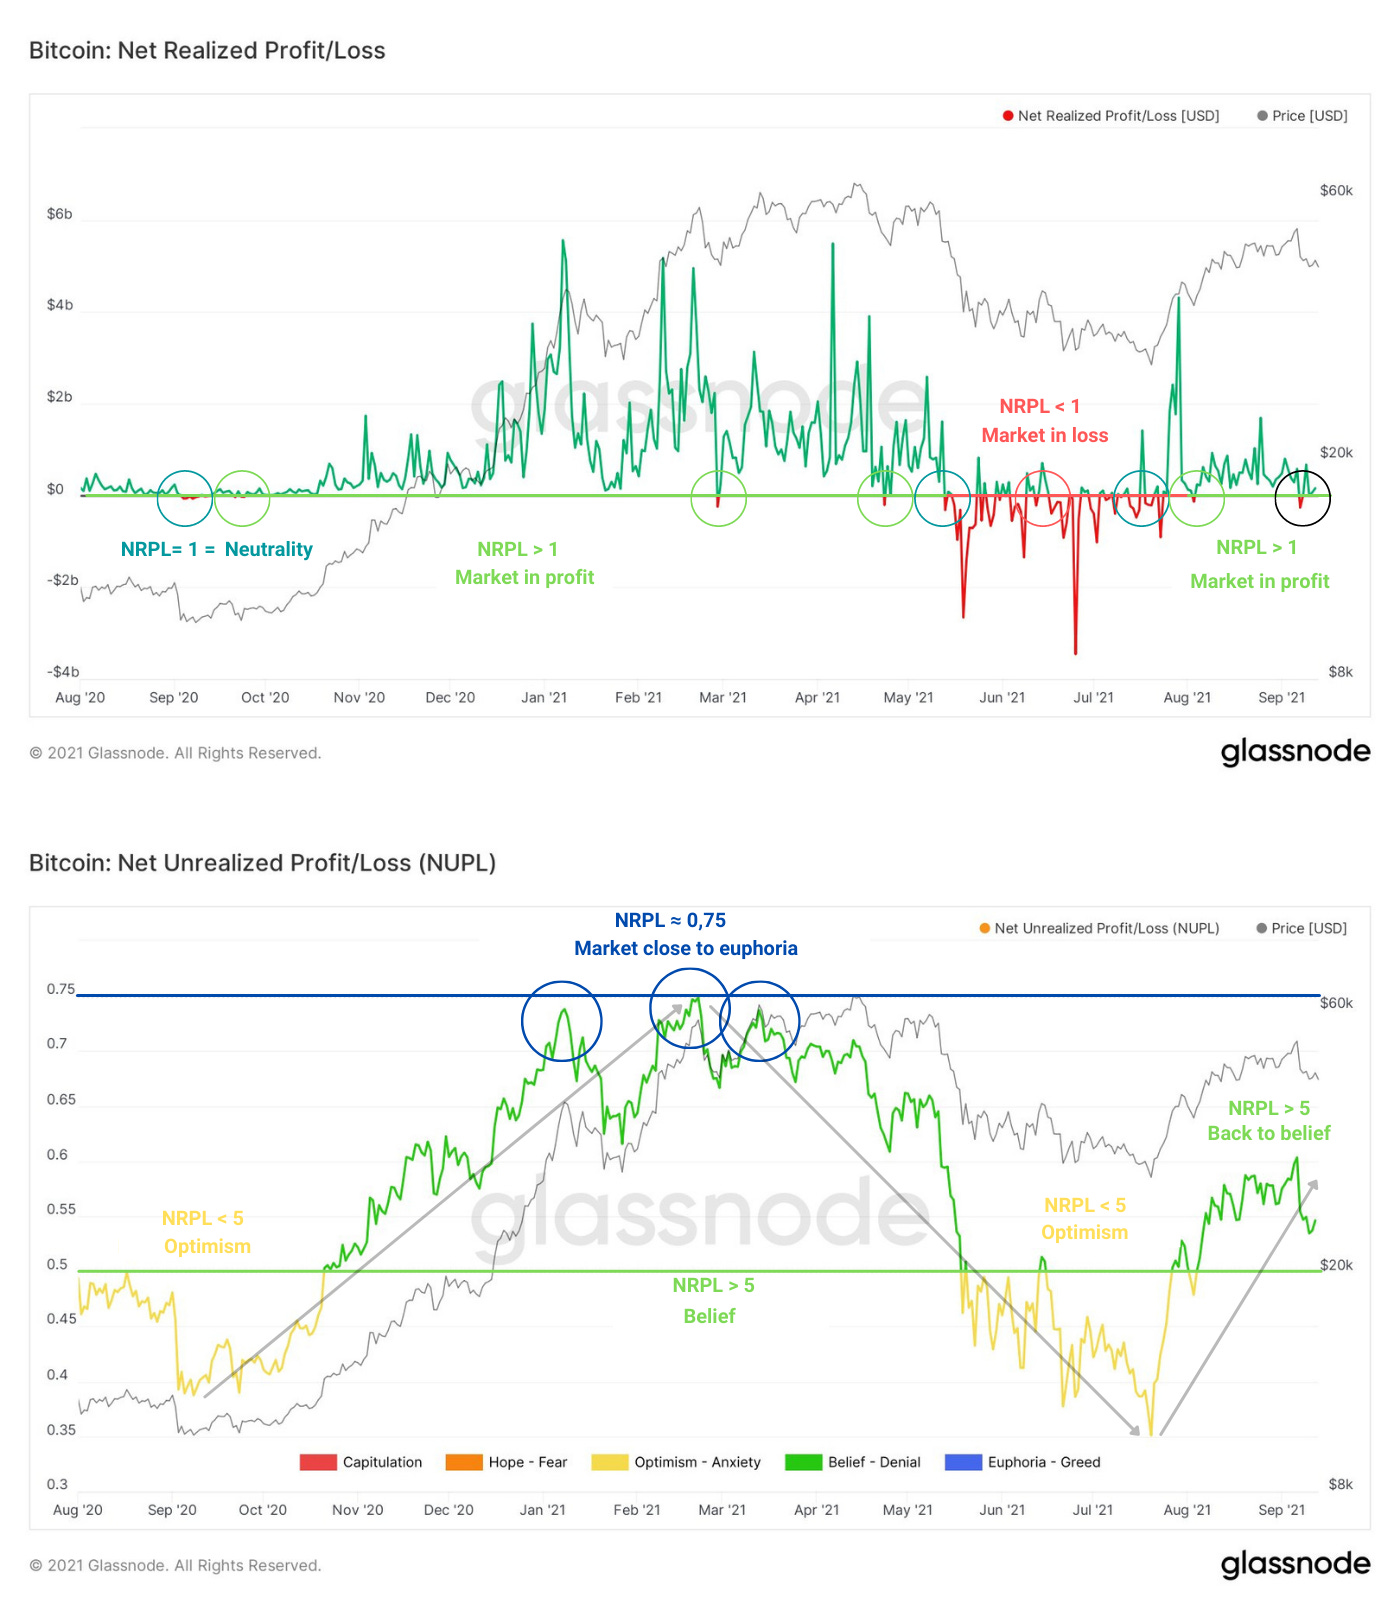
The aSOPR has been holding strong above the neutral zone, which has been its support since the beginning of August.

Combined with the NRPL, it tells us that the tokens traded this week have allowed the majority of their holders to realize profits.
Thus the market is still in a profitable state, a sign that a structural bear trend is not in play.
Indeed, the NUPL, an indicator of unrealized profits/losses has, since August, recovered a ratio above 5 (NUPL > 5).
Back in the optimistic zone, it informs us that players prefer to keep their BTC in order to realize greater profits in the future.
Focusing on tokens aged between 2 years and 1 month, we can see an encouraging dynamic.
At the peak of the 2017 bull run, old tokens from the 3 year to 6 month age bracket were distributed, LT holders exiting the market before the price collapse.
However, following the May correction, we can observe 2 things:
tokens aged from 3 years to 6 months maintain approximately the same proportion. They are neither accumulated nor distributed;
tokens aged from 6 to 1 month represent an increasing portion of the aging, indicating that a massive accumulation is underway.
Many of the younger tokens are maturing and moving into the older age groups. This doesn't really give the impression that HODLers have left the market, quite the contrary.

This observation is supported by the SOAB and SVAB metrics. Filtered to retain only transactions from long-term hodlers, they give great view of their involvement over time.
SOAB is a metric that groups spent ouputs into age categories and presents them in colored bands as a proportion of total tokens moved.
SVAB acts as a counterpart to the SOAB, and only considers the daily transaction volume based on age bands.

SOAB: we can observe several trading peaks :
in January 2018 during the dead cat bounce signaling the beginning of the bear market;
at the end of June 2018;
at the end of 2018, before the market capitulation;
in December 2019;
in July 2021, as the price of Bitcoin approached $50K.
Overall, it can be noted that the highs of 2018 did not reoccur during the recent rise, making a dead cat bounce scenario less likely to happen.
SVAB: we can detect significant trading volume :
in late 2018, when the market capitulates;
in July 2019;
from August 2020 to May 2021, during the rise of BTC
in July 2021, when the price of Bitcoin was coming out of the $30K consolidation.
After all, it seems that most HODLers have not yet exited the market, indicating that they are leaning more towards a continuation of the bull run than the beginning of a bear market.
As far as miners are concerned, they seem to be back to their accumulation routine.
Despite their propensity to liquidate their BTC compulsively to cover CAPEX and OPEX costs, they don't seem to overspend since the Great Migration.
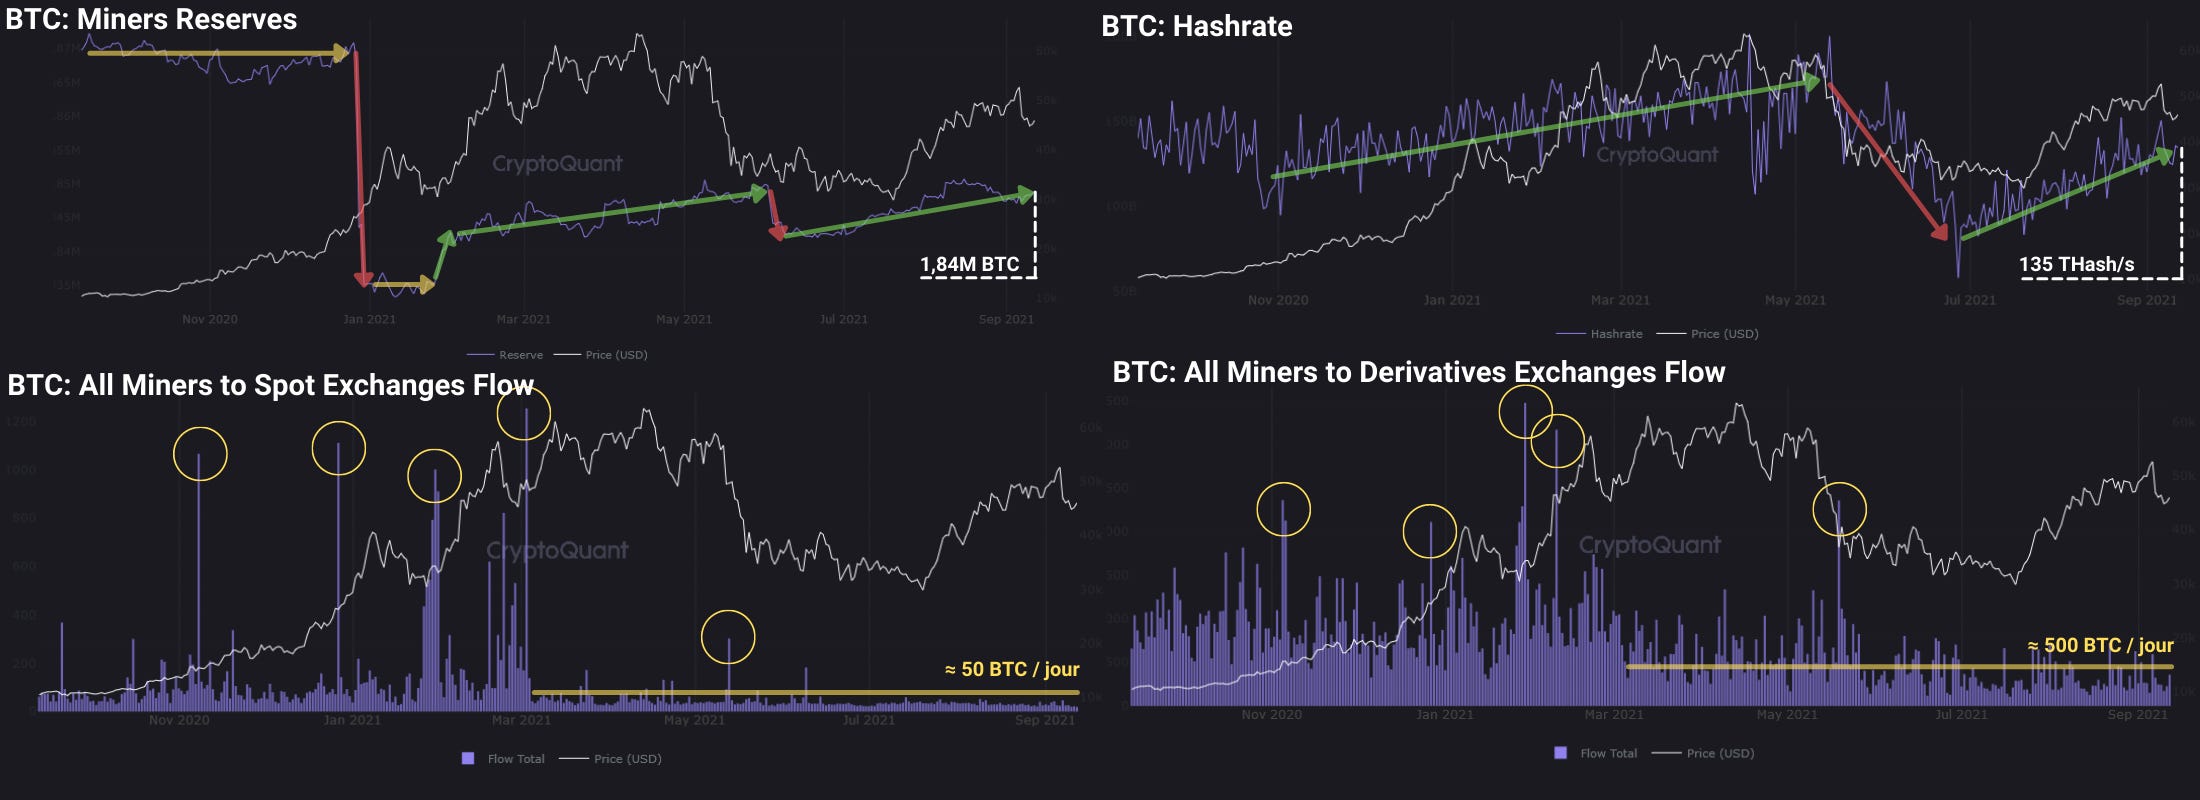
Curious fact that I was not aware of: it seems that miners have a inclination for derivatives markets!
I may be wrong but in terms of scale, the average trading volumes from miner’s wallets to derivatives markets (≈500 BTC/day) appears to be 10 times larger than for the spot market (≈50 BTC/day).
I should do some research on this...
Exchange reserves continue to be depleted
Without arguing too much, we could assume that if BTC leave the exchanges, they are - most of the time - bought with the purpose to be kept on the long term.
Overall, we can see that exchange reserves have fallen by about 10% (-2.38M BTC) since the end of 2020. Conversely, stablecoin reserves are increasing without weakening.
This is an excellent sign in terms of supply/demand dynamics. Less and less BTC are liquid while more and more capital is available to buy the remaining tokens.

For spot market reserves, the decline has resumed since the slight deposit phase that took place in mid-July.
Regarding the derivatives markets, I’ve noticed that a large flow of BTC was deposited there until May. However, this trend seems to be reversing.
So far so good, for 2 reasons:
A price increase from the spot market is healthier because it is not based on speculation but on a concrete demand.
Less capital in the derivatives markets = less speculators = less leverage and, ultimately, less probability of a flash crack.
To corroborate these observations, we can note that important outflows have taken place on all exchanges recently.

During the last few weeks, the study of BTC flows has brilliantly reflected the psychology of the participants:
+44.5K (spot): disengagement just before Bitcoin broke free of $30K;
-27.6K (spot) re-commitment once the price started its journey towards $40K,
-27.6K (derivatives) at about the same time;
-22.4K (spot) as the price consolidated over $50K;
+27.5K (derivatives) a few days later (this capital was probably part of the reason for the flash crack)
-19.1K (derivatives) after the flash crack, signifying a decrease in interest in the derivatives markets.
To Sum Up
This week, a sudden flash crack sent the Bitcoin price back below $50K and the 200DMA. Stemming from a cascade of liquidations, this violent drop purged the market of greedy speculators.
Nevertheless, most investors did not panic and it seems that the accumulation continues unabated.
Finally, exchanges reserves continue to reach lower and lower levels, while market demand show not sign of slowing down.