

JdB39 - EN : An unshakeable conviction
JdB39 - EN : An unshakeable conviction
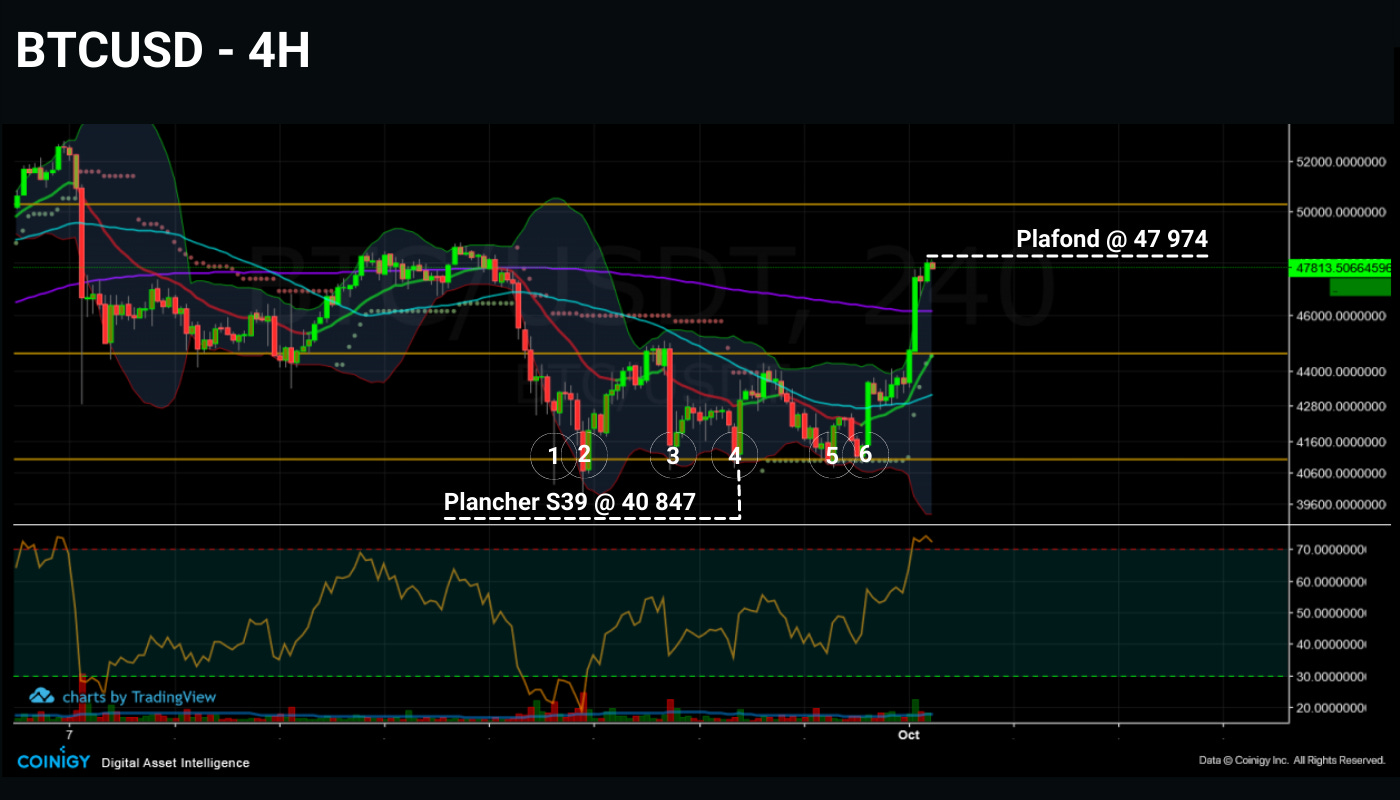
Breaking out of its recent range, Bitcoin is heading back towards $50K as accumulation accelerates and more and more tokens are maturing.

After repeatedly rejecting the $40K resistance, forming a weekly low of $40,487, the price of BTC is breaking out of its range, testing new local highs around $48K.
The crypto market is starting the month of October on a high note. While BTC was hovering between $40K and $45K in uncertainty, a strong bullish impulse (+12% in a few hours) finally pushed the price of Bitcoin to new highs.
Today, let's look at how the LTH have held their ground and exhausted the short term bearish speculators by their conviction in the last few weeks.
To do so, we will evaluate metrics related to :
accumulation;
coin maturation;
momentum.
Bears have lost a crucial battle
Let's start by looking at the daily liquidation amounts in the derivatives markets. It is clear from the left side of this chart that shorts have suffered heavy losses in the last 24 hours.
Ironically, while September had seen a heavy cascade of long liquidations, the first day of October reverses the trend by the use the same catalyst.

Naturaly, this event is not the only cause of the price increase. We are in a context of extreme price tension due to a unique accumulation phase and Bitcoin's price fluctuations are always the consequence of multifactorial causes.
However, it is important to note that after a 6th unsuccessful test of the $40K support, the scenario favorable to individuals hoping to profit from BTC's fall (closing below 40K + panic selling) seems less and less plausible.
Indeed, the study of spending behavior allows us to highlight some evidence. Looking at the recent gains/losses, we can see the underlying strength of the current market.
Despite 2 days with losses of $650M each during the 5th rejection, the market has absorbed the selling pressure without flinching. The neutral zone on the NUPL and the 0.5 threshold on the NRPL both acted as support, indicating that few unrealized profits have been realized.

The consensus is that although some small hands have been shaken, HODLers, investors with unbreakable conviction, have stood firm during the recent FUD storm and have not wished to leave the market.
This behavior is best illustrated by the SOAB and SVAB metrics, which depict the age of BTC tokens spent, in terms of quantity and volume respectively.
Concerning the spent coins of the month of September, we observe a continuous decrease in the number and the volume of tokens older than 6 months. This shows that the majority of the tokens spent recently are young ones.
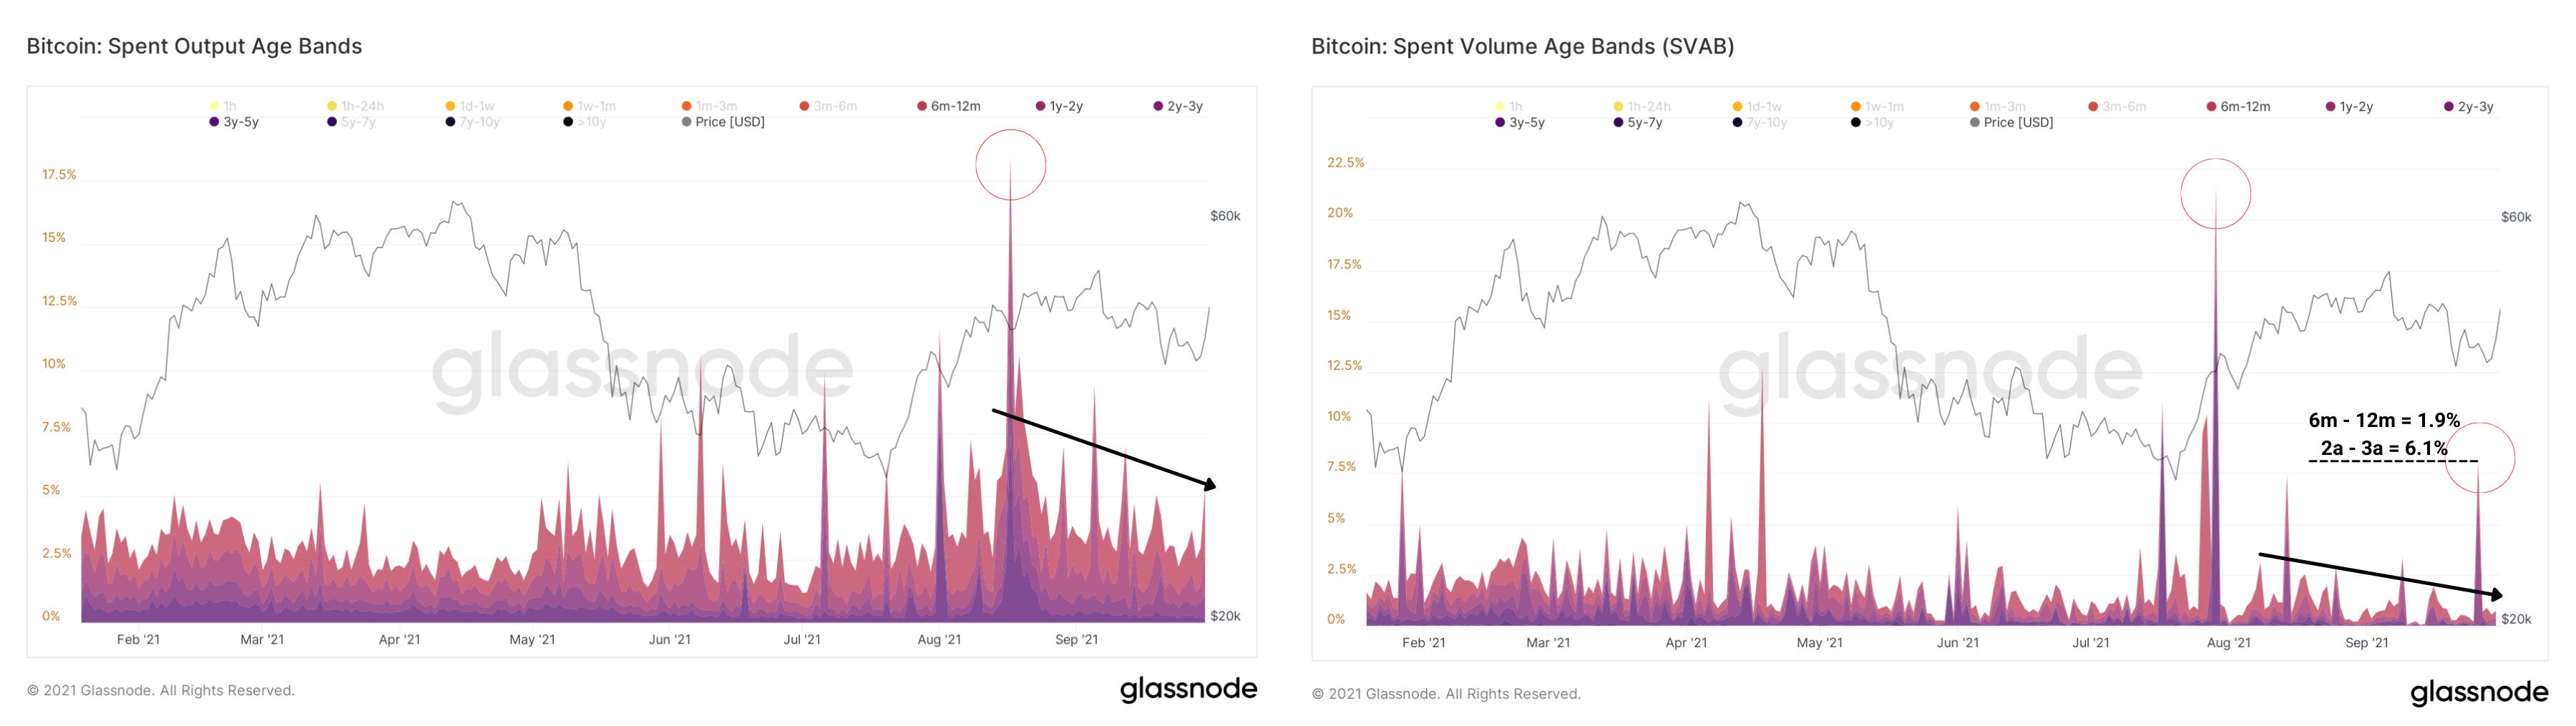
Held for less than 6 months, they often represent assets belonging speculators and short-term traders. Volatility hunters, they hold risky positions and can be the cause of cascading liquidations when excessive leverage is used.
Accumulation and maturation
As @CryptoVizArt, on-chain analyst at CryptoQuant points out, each of the recent dips has thus been a buying opportunity for an individual driven by a long-term bullish bias.


The change in exchange reserves demonstrates precisely this fact by highlighting that between April 19 and May 17, approximately 125K BTC were deposited on the exchange platforms.
Providing liquidity within a market in accumulation phase, this deposit wave represents a rare chance to buy large volumes of BTC tokens at a discounted price.

Looking at the dynamics of the global BTC supply, available via checkonchain.com (aka COC), we can see that the STHs dominance is decreasing while LTH are gaining strength since May.
It is curious to note that during this bullrun, the first phase of LTH distribution animated the market from the end of 2020 until May 2021. It is during this period that a wave of BTC tokens are transferred from LTH (blue) to STH (pink).
Having accumulated a lot of BTC before, the LTHs thus created the conditions for a liquidity shock to be triggered and push the price of BTC upwards while they were making profits from some of their assets.
Thus, the available supply of BTC changes hands over the course of market cycles, before the eyes of those willing to see it.

However, previous bullruns have had a specific point where the supply held by STHs was greater than that of LTHs.
That point defines where distribution stops and accumulation begins a new cycle. And that point has not yet come in the current bullrun.
By the end of May, as BTC fell off its ATH and caused the market to realise huge losses, LTHs aggressively resumed their accumulation, raking in tokens at a 50% discount.
Watching tokens being accumulated and maturing, we can see that LTH has a particular propensity to store tokens for long periods.
They show a strong belief in Bitcoin's value proposition, both as a store of value and as a utility token for the eponymous network.
Momentum Divergence
Considering the dynamics in which tokens mature or rejuvenate allows one to visualize the groundswells that drive the Bitcoin market.
Maturation waves (black), a metric derived from HODL Waves, is a good illustration of this phenomenon and describes the alternating behavior of long-term investors.

Symbolizing the 60-day change in the distribution of each token age band, a value greater than 0 for the HOLDers change will indicate an acceleration of LTH accumulation. Conversely, a negative value will indicate a decrease in the momentum of this dynamic.
Although the current market structure is unique, the behavior of this momentum during the bull runs of 2013 - 14 and 2021 has similar variations:
1st acceleration of the accumulation at the beginning of the bull run;
slowdown & distribution in the market strength;
2nd acceleration during a strong correction.
And while LTH accumulation is gaining momentum, the BTC price momentum indicates a slowdown.
Indeed, by examining the following oscillator, we can gain fascinating insight into the relative dynamics between spot and on-chain prices.
This unusual metric measures the "verticality" of a price movement relative to a variable base: the realized capitalization of Bitcoin.
To do so, the average price progression of the last 28 days is measured for both the (spot) price and the (on-chain) realized price.
The delta calculates the difference between the market gradient and the realized gradient to represent the momentum of the spot price relative to the value stored in the asset.
Thus, the more the price moves vertically, indicating acceleration, the steeper the gradient, and the greater the value of the oscillator.
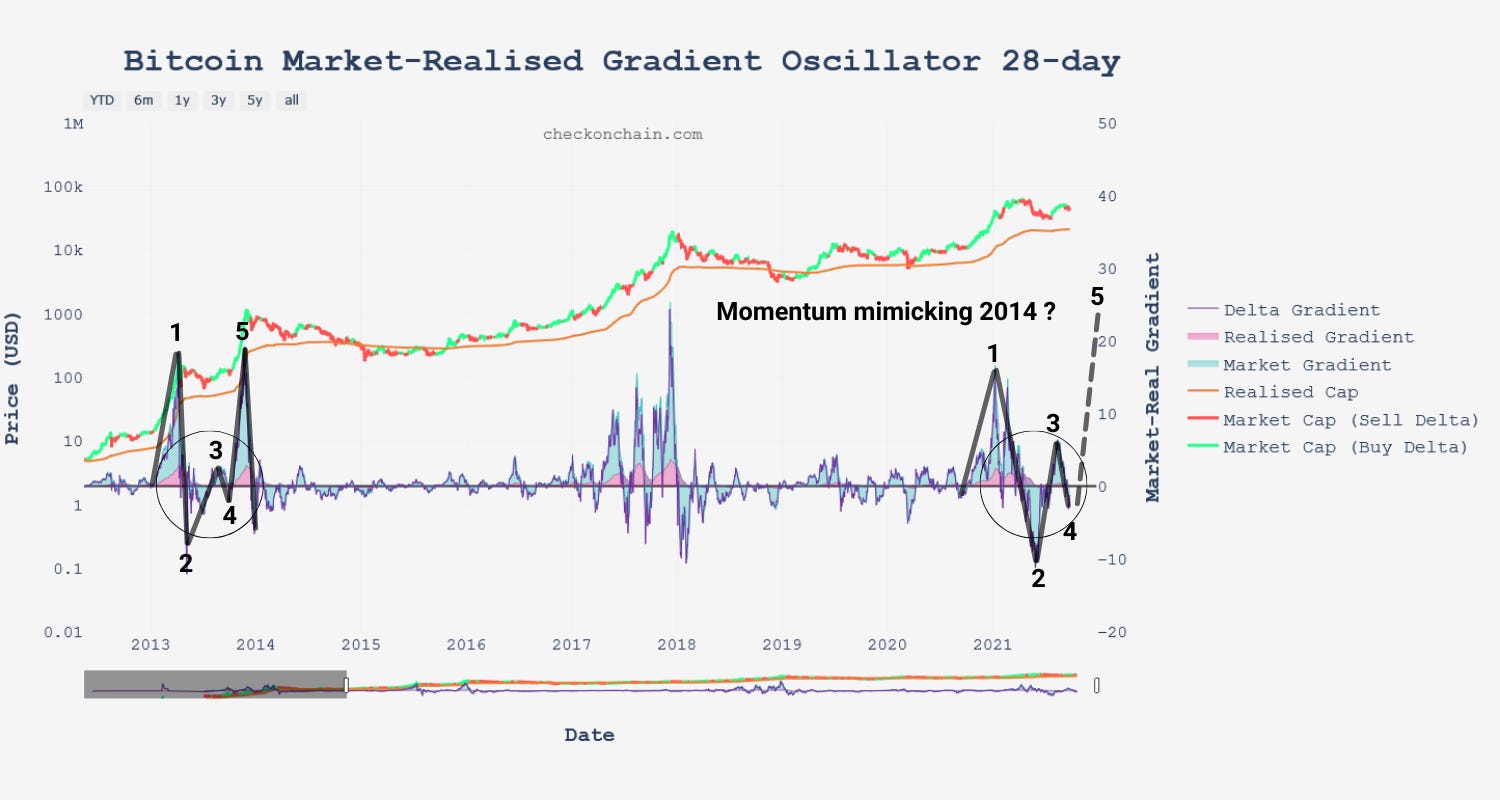
When applied to the study of market behavior, very sharp rises or falls in this oscillator tend to signal blow-off tops, capitulations and major market reversals.
Currently printing a slightly bearish momentum, it would be plausible to see the price of Bitcoin accelerate upwards as the accumulation slows down.
Thus, a new distribution phase could fuel the next leg up by allowing LTHs to increase the overall realized price of Bitcoin by transferring their tokens to STHs.
To Sum Up
In recent days, the price of BTC has rejected $40K support numerous times before breaking out of its range following a series of short liquidations.
Each dip is being cheerfully bought by LTHs, their held supply rising without faltering since the May sell-off.
As the accumulation accelerates, Bitcoin's price momentum indicates a slowing of its velocity.